In supervised machine learning, training data is labeled meaning every input value corresponds to an output value. Classification is the type of supervised learning where data is categorized into two or more classes. The algorithm learns from the given dataset and then classifies new data.
The output in classification is qualitative, either 1 or 0. 1 could represent that a data point belongs to a class and 0 could represent that it does not belong to the class.
Let’s take the example of ice cream and milkshakes. The training dataset may contain some images with some of them labeled ice cream and some milkshakes. When the model is trained sufficiently, it categorizes new images under the classes ice cream and milkshake.
The relationship between input and output in classification is based on the following function:
$$y=f(x)$$
Where \(y\) is the output variable and \(x\) is the input variable. The classification algorithm can be better understood through the diagram below.
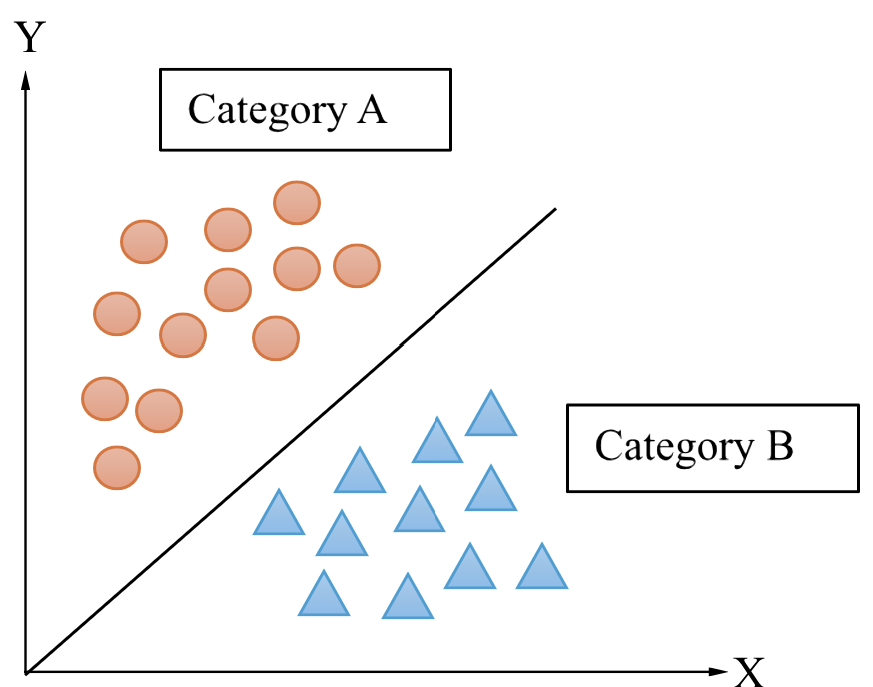
.All the members in class A have something in common and all the members in class B have something in common. For example, ice cream can have cones in common and milkshakes can have cups in common. This could be the distinguishing point for categorizing.
Type of Learners
Learner algorithms in classification are divided into two types i.e. eager learners and lazy learners.
- Eager Learners – They spend more time training because they are eager to grasp most trends emerging from the dataset. However, they require less time to make predictions.
- Lazy Learners – These algorithms do not spend time training, rather they store the training dataset and make predictions using it when the test dataset is provided. This means that they take considerably more time to predict.
Evaluation of a Classification Model
The same problem and the same set of training data can produce a higher number of different models, so the need arises for the evaluation of the quality model concerning the given problem (Dj et al., 2017).
Dj et al. (2017) writes in his article that the task of evaluating classification models is to measure the degree to which the classification suggested using the model corresponding to the actual classification of the case.
If the applied model gives a different predicted result than the actual result then classification is not accurate. The errors in a practical problem are distinguished and the classification is shown in the form of a 2D matrix where the rows represent the predicted class, and the columns represent the actual class. The diagonal of the matrix consists of the correct classified examples. This matrix is also called the confusion matrix which provides a better analysis for different types of errors.
There are four different outcomes. The errors are called false positives and false negatives while the actual or positive and actual or really negatives are the actual values. False positive is the negative example that is wrongly classified in a positive class and false negative is a positive example that is wrongly classified in the negative class.
The formulas for calculating the values are given below:

These are the standard terms defined in the matrix with two classes. The accuracy is the population of true results (both true positives and true negatives) among the total number of cases examined and precision is the positive predictive value which presents the fraction of predictive positive cases that are accurate (Dj et al., 2017).
There is another way to evaluate the model or classifier which is called the ROC curve. ROC stands for the Receiver operating characteristics curve. The \(x\)-axis represents the false positive rate, and the \(y\)-axis represents the true positive rate. When all the cases are positive, the point on the graph \(P(1,1)\) , and when all cases are negative, the point on the graph is \(P(0,0)\). \(P(1,0)\) means that all the classifications are incorrect.
Types of Classification Algorithms
- Logistic regression.
- Support Vector machines (SVM).
- Naïve Byes.
- Decision Tree classification.
- Random Forest classification.
- Kernel SVM.
- K-Nearest neighbor.
Applications of Classification
- Image classification
- Sentiment analysis.
- Email spam detection.
- Document classification.
- Medical diagnosis
- Transportation
- Sustainable agriculture
Conclusion
In conclusion, classification in supervised machine learning is a powerful technique used to categorize data into different classes based on labeled training datasets. Through classification algorithms, such as logistic regression, support vector machines, decision trees, and others, machines learn to make predictions and classify new data points into predefined categories.
Evaluation of classification models is crucial to assess their performance and accuracy. Confusion matrix, accuracy, precision, and receiver operating characteristic (ROC) curve analysis provide insights into the model’s effectiveness in correctly classifying instances.
The applications of classification are vast and diverse, ranging from image classification and sentiment analysis to email spam detection and medical diagnosis. Industries such as transportation and agriculture also benefit from classification techniques to improve efficiency and sustainability. Overall, classification algorithms play a vital role in various domains, enabling automated decision-making and data-driven insights. As technology advances and datasets grow, the importance and applications of classification in real-world scenarios continue to expand, driving innovation and progress in diverse fields.
Citation
- Dj, J., Novaković, Veljović, A., Ilić, S., Papić, Ž., & Tomović, M. (2017). Evaluation of Classification Models in Machine Learning. Theory and Applications of Mathematics & Computer Science, 7(1), 39–46. https://typeset.io/pdf/evaluation-of-classification-models-in-machine-learning-1u2pog86m5.pdf
Leave a Reply