Regression is a type of supervised learning where the algorithm predicts a continuous value. Since it comes under supervised learning, a labelled dataset is already provided for the model to train and familiarize itself with it. A relationship between input and output variables is established that tells us how one variable affects the other. It is a statistical method used in investing, finance, and other disciplines because of its ease of use in prediction.
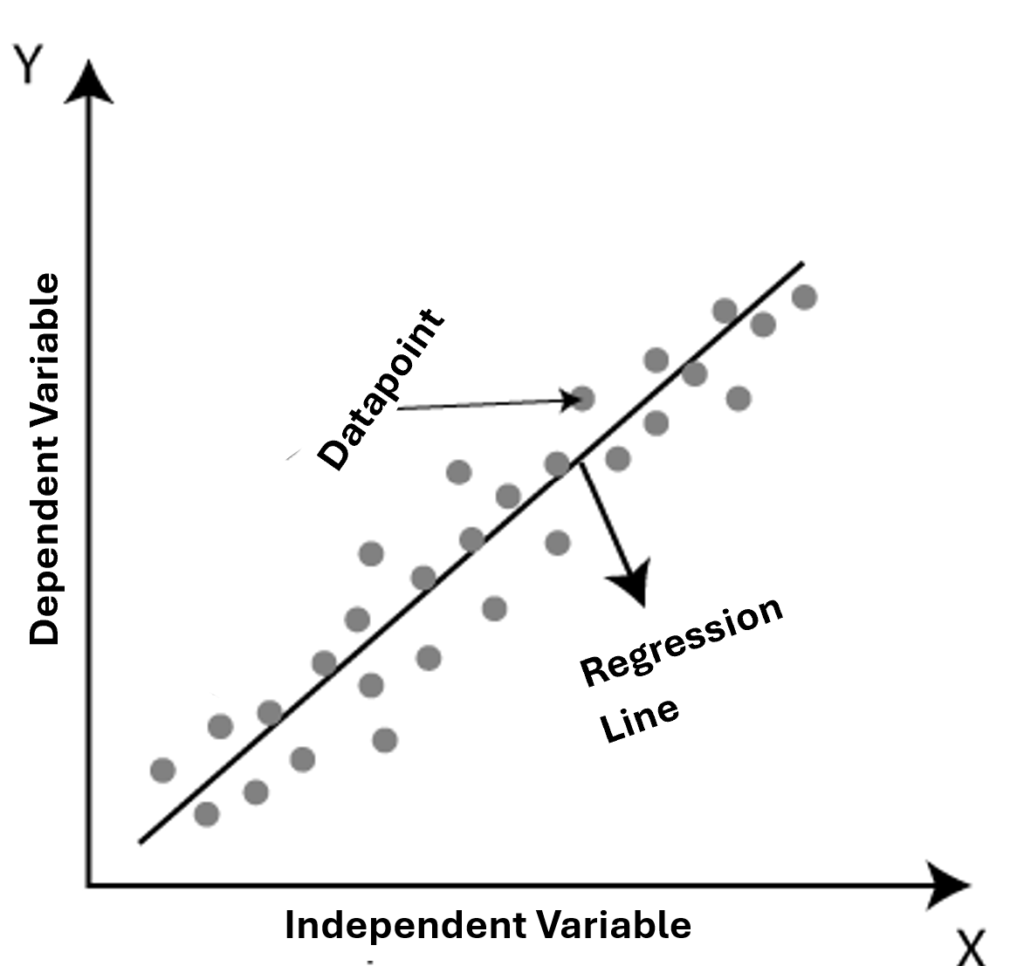
The dependent variable is output (usually denoted by \(y\)), and the independent variable is input (usually denoted by \(x\)) and the relationship between them is the function. This means that the output value is dependent on the input value related by the function between them.
Regression analysis is used to uncover association trends between data points. It does this by plotting a line or curve on a graph between the variables that best fit given data points or values. That line passes through all the data points in such a way that the vertical distance between the data points and the regression line is minimal.
By using regression analysis, we can predict the most important factor, the least important factor, and the effect of each factor on another factor. The training data provided to the regression model is vital because it plays the most important role in the prediction of accurate output. The wrong training data will result in wrongly assumed trends emerging from it and lead to inaccurate results.
Evaluation of the Algorithm
When the algorithm makes a prediction, it is evaluated to get insights into the accuracy of predicted results. To do this, some important metrics are considered. The first is the variance, which is the change in the target function when a different set of training data is used. Variance should be low to ensure the accuracy of the prediction. If the model exhibits a change in the target function, then the predicted result by the model is not accurate. This is why the model should be trained on a general dataset and not a specific one.
The second important metric that needs to be considered is biasing. It is when the algorithm tends to consider the wrong things when learning and not the whole dataset. This causes it to predict the wrong thing. This is why, for accurate predictions, bias also needs to be low. High bias means the algorithm is not accurate.
Bias and variance are always in a trade-off. When the bias is high, the variance is low and when the variance is low, the bias is high. The former case arises when the model is too simple with a fewer number of parameters and the latter when the model is complex with numerous parameters.
Other metrics include error which is the difference between the actual and predicted value or the deviation from the actual result and accuracy which is the number of outputs the model got right. To reduce the error, we use the error function. So, for an ideal model, the error, bias, and variance should be low.
Two more key terms are associated with the evaluation of regression analysis. These are overfitting and underfitting. We know that the model learns by being trained on a dataset before being used on test data. If the model is copying or memorizing the training data instead of learning or deriving patterns from it, then it will fit too closely with the training data and deviate considerably from the test data making the variance and bias of the model high. This phenomenon is called overfitting. Where underfitting is when the model is not deriving patterns from the dataset properly, so it is not making accurate predictions. In underfitting, the model is performing well on the test data but not on training data.
Linear Regression
There are different types of regression algorithms and all of them are applied based on the presented problem or circumstances. The mathematical formula for linear regression is discussed below.
The simplest type of regression, linear regression involves only one independent variable and the relationship between only two variables, that are the dependent and independent variables, is to be determined.
A linear relationship is assumed between the variables that is represented by the following equation:
$$y=f(x)$$
The curve is a straight line at an angle on the graph where \(x\) is the independent variable and \(y\) is the dependent variable. Linear regression is a relatively easy model, and the mathematical formula is understandable for most people, so it is used by a wide range of industries. They are scientifically and reliably able to predict the result.
In linear regression, the line is adjusted to best fit the data points. Consider the following equation:
$$y=mx+c$$
Where m is the slope and \(c\) is the intercept which is the value of y when \(x\) = 0.
There are two types of linear regression, simple and multiple linear regression. The simplest form of linear regression, involving a single independent variable, is called simple linear regression. The model can be expressed as:
$$y=\beta_{0} + \beta_{1}x + 𝜖y=\beta_{0} + \beta_{1}x + 𝜖$$
Where \(y\) is the dependent variable, \(x\) is the independent variable, \(\beta_{0}\) is the \(y\)-intercept, \(\beta_{1}\) is the slope of the regression line (the change in \(y\) for a one-unit change in \(x\), and 𝜖 is the error term.
In multiple linear regression, where there are multiple independent variables, the model is extended to:
$$y=\beta_{0} + \beta_{1}x_{1} + \beta_{2}x_{2}+⋯+ \beta_{n}x_{n} + $$ $$𝜖y=\beta_{0} + \beta_{1}x_{1} + \beta_{2}x_{2}+⋯+ \beta_{n}x_{n} + 𝜖$$
Where \(y\) is the dependent variable, \(x\) represents the independent variables, \(\beta_{0}\) is the intercept, \(\beta_{1}\), \(\beta_{2}\), etc. are the coefficients or slopes for the independent variables and 𝜖 is the error.
The objective of linear regression is to find the values of \(\beta_{0}\), \(\beta_{1}\),…, \(\beta_{n}\), that minimize the sum of the squared errors (SSE) between the observed values and the predicted values. This is known as the least squares method. The best prediction is assumed to reduce the sum of squared errors. This method is often applied in data fitting, a crucial tool in data analysis, allowing for the extraction of meaningful insights and predictions from empirical data.
Linear regression is a fundamental technique in statistical modeling and machine learning, providing a simple yet powerful way to understand relationships between variables and make predictions.
Leave a Reply